Historical High Rock Lake levels
Versus
High Rock Operating Guide proposed in AIP
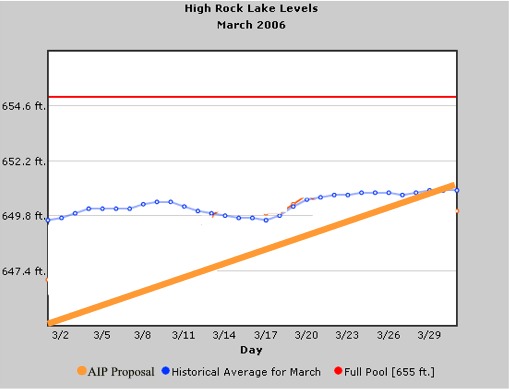
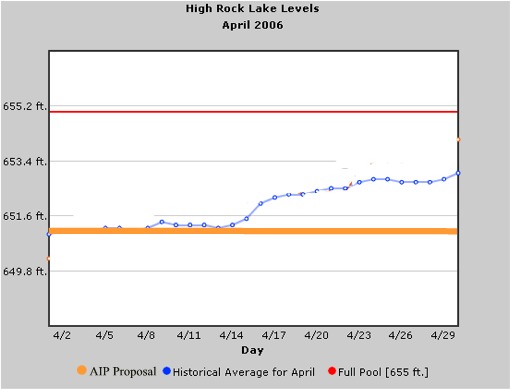
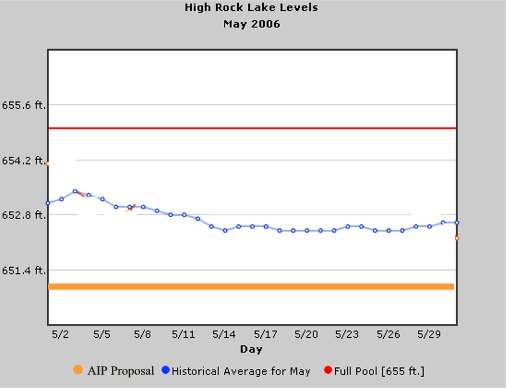
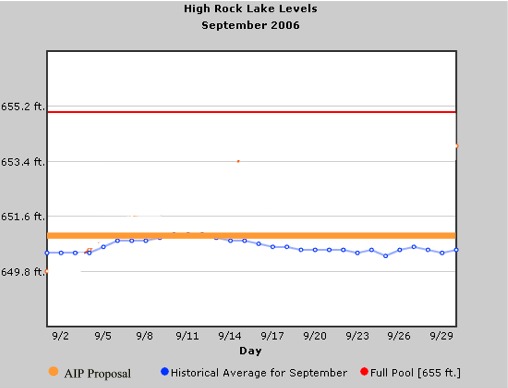
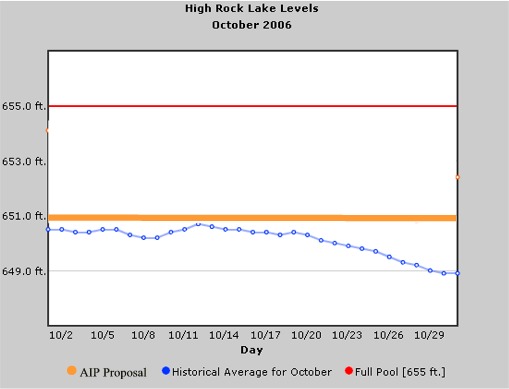
Is the Operating Guide being proposed in the
AIP an improvement over the past or just a new way of saying operate High Rock
Lake almost exactly as in the past but remove the current restrictions as lake
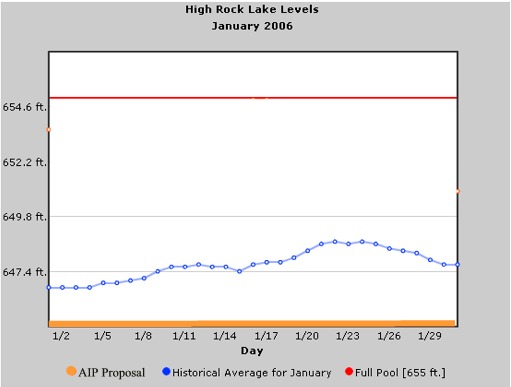
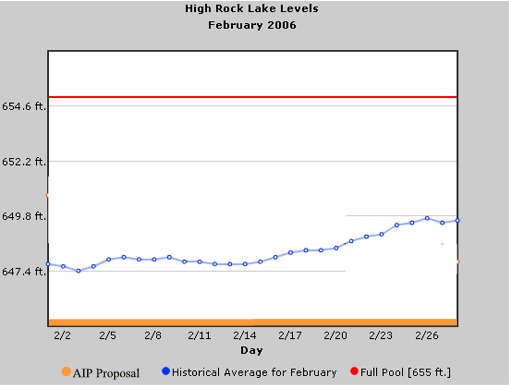
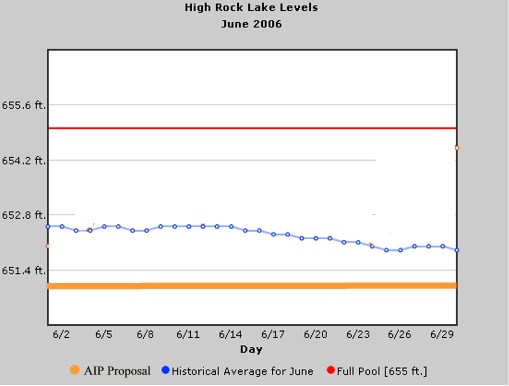
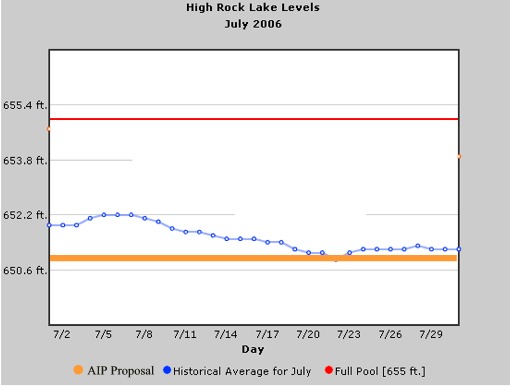
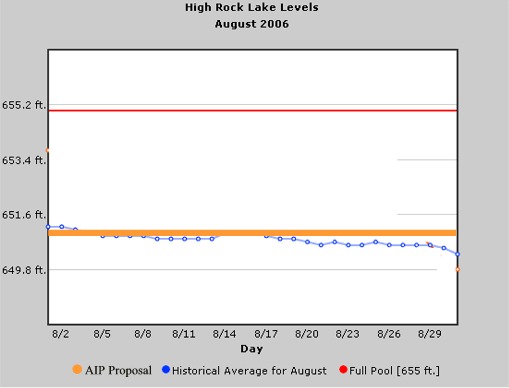
levels fall? The blue lines represent the average lake levels of the past as shown on Alcoa's web site. Keep in mind that if you removed
the 17 to 24 foot drawdowns that occurred in the summer of 2002, the summer averages would be
almost a foot higher.
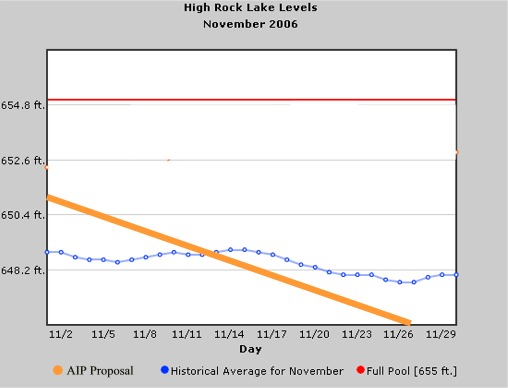
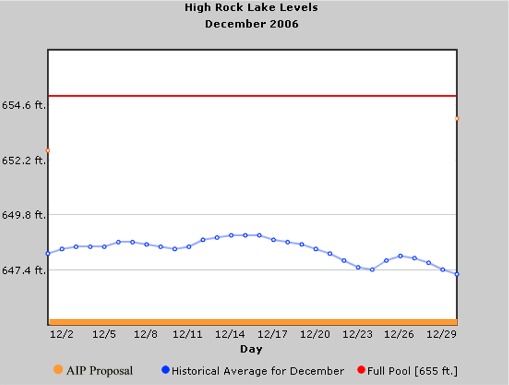
Another view would be to compare the 4/10
foot guide to the historical averages of the last 20 years
Historical High Rock Lake Water Levels
(Measured at High Rock Dam)
This chart indicates what typical lake levels have been each month, based on historical data from 1986-2006.*
| Month |
Average Feet Below Full1 |
Range Of Average Highest To Average Lowest Feet Below Full2 |
Lowest Feet Below Full3 |
Median Feet Below Full4 |
 |
|
|
| January |
7.3 |
4.0 - 11.8 |
19.4 |
7.5 |
|
|
|
| February |
6.8 |
3.5 - 10.2 |
17.9 |
6.5 |
|
|
|
| March |
4.7 |
2.3 - 7.7 |
16.5 |
4.3 |
|
|
|
| April |
3.1 |
1.2 - 5.4 |
11.4 |
2.9 |
|
|
|
| May |
2.3 |
1.1 - 3.5 |
6.4 |
2.2 |
|
|
|
| June |
2.7 |
1.4 - 4.0 |
16.4 |
2.1 |
|
|
|
| July |
3.5 |
2.2 - 4.7 |
24.0 |
1.9 |
|
|
|
| August |
4.2 |
2.8 - 5.5 |
19.8 |
3.1 |
|
|
|
| September |
4.4 |
2.8 - 6.0 |
16.4 |
3.9 |
|
|
|
| October |
4.9 |
3.0 - 7.3 |
10.9 |
4.8 |
|
|
|
| November |
6.6 |
4.6 - 8.8 |
13.4 |
6.7 |
|
|
|
| December |
6.8 |
4.0 - 9.7 |
14.2 |
7.4 |
|
|
|
1 This is the average of daily water level readings for each month.
2 This is the range of the average of the highest daily water level readings and the lowest daily water level readings for each month.
3 The maximum drawdowns generally occurred in drought years.
4 One half of the daily water level readings are above this figure and one half were below this figure for each month.
* Data Source = http://www.alcoa.com/yadkin/en/environment/high_rock_graph.asp
|
|